How I Would Use AI to Reduce Manual Reporting by 60% for a B2B Team in 60 Days

How I Would Use AI to Reduce Manual Reporting by 60% for a B2B Team in 60 Days
Context

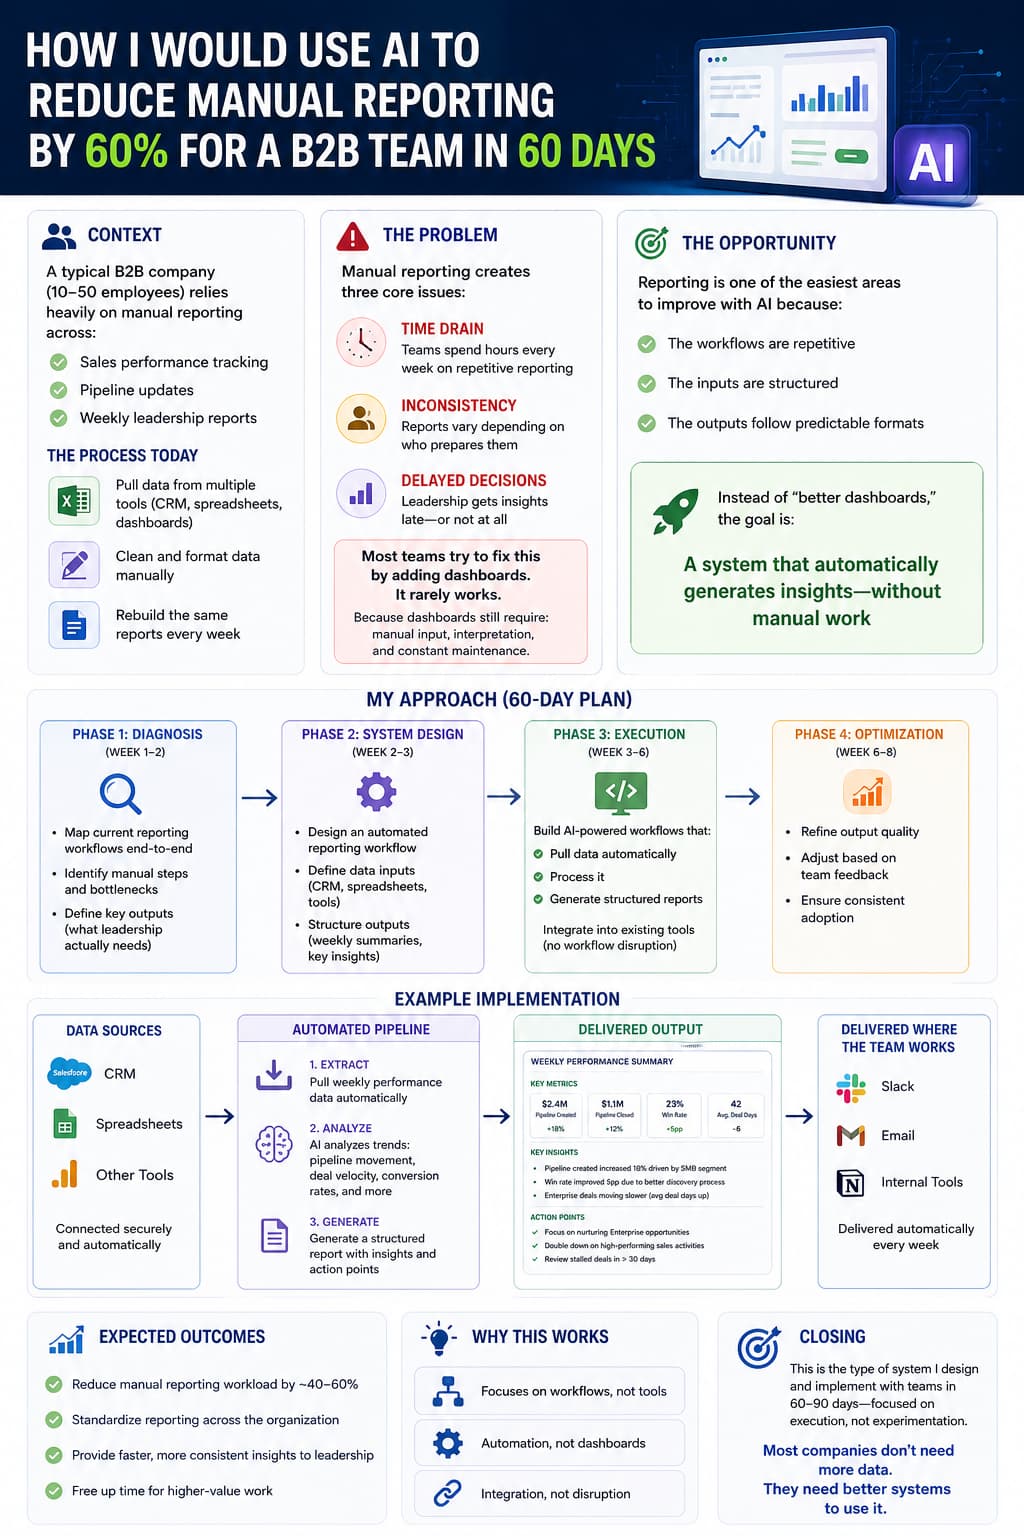
A typical B2B company (10–50 employees) relies heavily on manual reporting across:

  • Sales performance tracking
  • Pipeline updates
  • Weekly leadership reports


These processes usually involve:

  • Pulling data from multiple tools (CRM, spreadsheets, dashboards)
  • Cleaning and formatting data manually
  • Rebuilding the same reports every week


The Problem


This creates three core issues:

  • Time drain: Teams spend hours every week on repetitive reporting
  • Inconsistency: Reports vary depending on who prepares them
  • Delayed decisions: Leadership gets insights late—or not at all


Most teams try to fix this by adding dashboards.

It rarely works.

Because dashboards still require:

  • manual input
  • interpretation
  • and constant maintenance


The Opportunity


Reporting is one of the easiest areas to improve with AI because:

  • the workflows are repetitive
  • the inputs are structured
  • the outputs follow predictable formats


Instead of “better dashboards,” the goal is:

A system that automatically generates insights—without manual work


My Approach (60-Day Plan)

Phase 1: Diagnosis (Week 1–2)

  • Map current reporting workflows end-to-end
  • Identify manual steps and bottlenecks
  • Define key outputs (what leadership actually needs)


Phase 2: System Design (Week 2–3)

  • Design an automated reporting workflow
  • Define data inputs (CRM, spreadsheets, tools)
  • Structure outputs (weekly summaries, key insights)


Phase 3: Execution (Week 3–6)

  • Build AI-powered workflows that:
    → pull data automatically
    → process it
    → generate structured reports
  • Integrate into existing tools (no workflow disruption)


Phase 4: Optimization (Week 6–8)

  • Refine output quality
  • Adjust based on team feedback
  • Ensure consistent adoption


Example Implementation

For this company, I would:

  • Connect CRM and reporting data sources
  • Create an automated pipeline that:
    → extracts weekly performance data
    → analyzes trends (pipeline movement, deal velocity, conversion rates)
    → generates a structured report
  • Deliver output as:  clean summary, key insights, action points 


Delivered directly where the team already works (Slack, email, or internal tools)


Expected Outcomes

  • Reduce manual reporting workload by ~40–60%
  • Standardize reporting across the organization
  • Provide faster, more consistent insights to leadership
  • Free up time for higher-value work

Why This Works


Because it focuses on:

  • workflows, not tools
  • automation, not dashboards
  • integration, not disruption


Most companies don’t need more data.


They need better systems to use it.


Closing

This is the type of system I design and implement with teams in 60–90 days—focused on execution, not experimentation.

Unlock Your Business Potential with AI

Ready to Transform Your Business with AI?

Let’s Turn Strategy Into Results.

I help leaders implement AI that drives measurable growth, efficiency, and competitive advantage—without wasting millions on projects that fail.

Discover the power of AI with our
expert-led courses.

Take the next step toward working smarter, boosting productivity, and transforming your daily workflow.
Created with